Value Change Indicator #
Introduction #
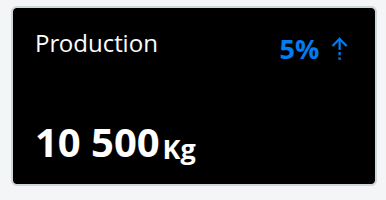
The Value Change Indicator is a compact KPI tile that highlights a current value alongside its change relative to a previous reference value. It is designed for at-a-glance monitoring of key metrics on dashboards, showing both the headline number (with unit) and an arrow-based diff that signals whether the value is trending up or down.
Features #
- Six display modes: Last Value, Average Value, Horizontal Bar Chart, Sum of Values, Week-Year Comparison, and Month-Year Comparison
- Diff value as absolute change or percentage, with directional arrow indicator
- Configurable decimal places for both the main value and the diff
- Optional auto-refresh via
updateFrequency(in seconds) - Inline or stacked layout for title, subtitle, value, and diff
- Tooltip showing current and previous values with their timestamps
- Double-click opens a full dataset line chart dialog for deeper inspection
- Supports custom reference time, calendar type (incl. 4-4-5), and “start of project” baselines
- Option to use data only up to the last finished week or month
- Hide-when-zero/positive behavior for conditional display
- Report mode with configurable width for use in printed reports
Use Cases #
- Highlighting production, consumption, or cost KPIs on a dashboard
- Comparing current period performance against the previous period
- Tracking year-over-year change for a given week or month
- Showing cumulative totals (e.g., monthly sum) with trend context
- Visualizing distribution of a value across an aggregation period via the horizontal bar mode
- Embedding summary KPIs in reports alongside detail charts
Example #