Periodic Bar Chart #
Introduction #
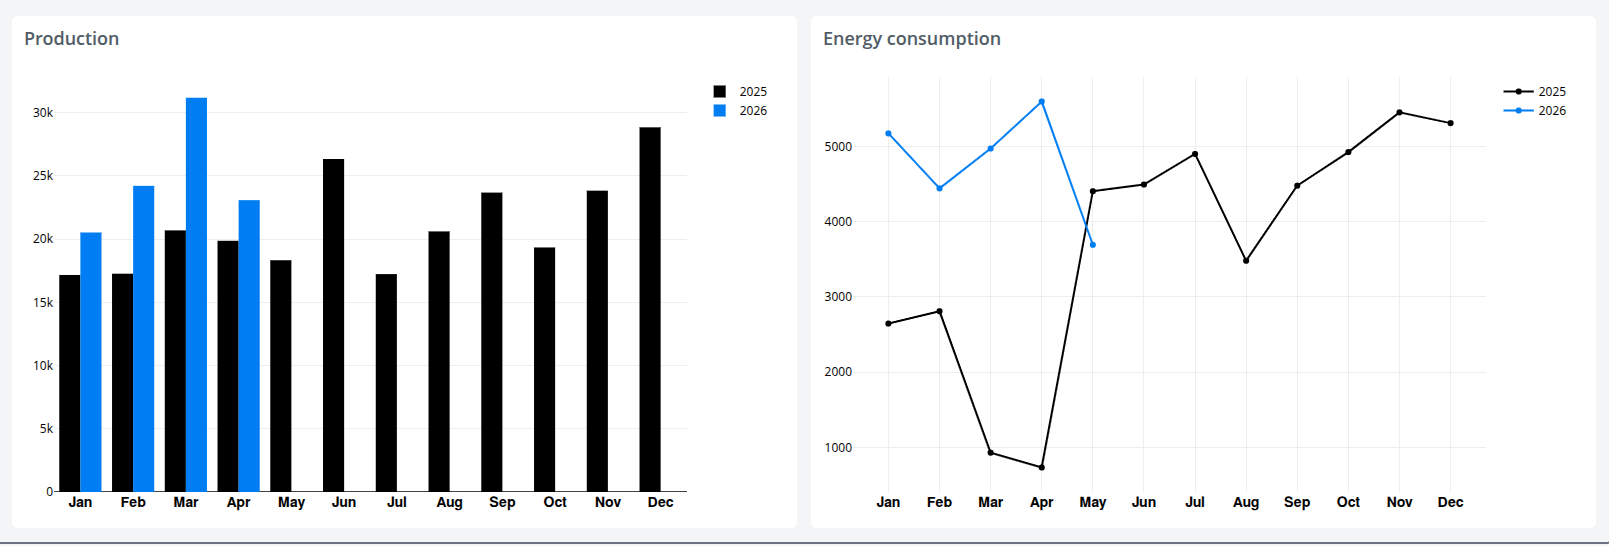
The Periodic Bar Chart visualizes dataset values aggregated into uniform time buckets and is designed for comparing the same period across cycles — for example, month-by-month consumption for the current year against the previous year. It can be rendered as either bars or lines and supports a variety of comparison periods, aggregation types, and date-range selection strategies.
Features #
- Bar or line chart rendering, switchable via
chartType - Multiple comparison periods: hourly-daily, daily-weekly, weekly-monthly, weekly-yearly, monthly-yearly, or no comparison
- Grouping modes: yearly (cycle-over-cycle comparison) and continuous (single time series)
- Configurable aggregation type (sum, average, min, max, etc.)
- Flexible date-range selection: custom range, load-configuration driven, full month, or full year
- Options to use data only up to the last finished week or month
- Hide future (unfilled) buckets and toggle legend visibility
- Adjustable chart margins, width, and height
- Configurable auto-refresh via
updateFrequency - Theme-aware coloring, with weeks-range start/end offsets for fine-tuned windows
Use Cases #
- Year-over-year comparison of production, consumption, or cost by month
- Week-over-week or day-over-day operational monitoring
- Visualizing seasonality and recurring patterns in time-series data
- Tracking KPIs across reporting periods aligned to a fiscal calendar
- Embedding periodic summaries into dashboards or printed reports
Example #